Notice: Function _load_textdomain_just_in_time was called incorrectly. Translation loading for the rocket domain was triggered too early. This is usually an indicator for some code in the plugin or theme running too early. Translations should be loaded at the init action or later. Please see Debugging in WordPress for more information. (This message was added in version 6.7.0.) in /var/www/practical-tips.com/wp-includes/functions.php on line 6114

Notice: Function _load_textdomain_just_in_time was called incorrectly. Translation loading for the soledad domain was triggered too early. This is usually an indicator for some code in the plugin or theme running too early. Translations should be loaded at the init action or later. Please see Debugging in WordPress for more information. (This message was added in version 6.7.0.) in /var/www/practical-tips.com/wp-includes/functions.php on line 6114
Excel:创建直方图 - Practical Tips

Excel:创建直方图

by Mike

在Excel中,您可以创建具有相同大小的类别的清晰直方图。Excel还可以自动计算累积频率。

在Excel中创建直方图——操作方法如下

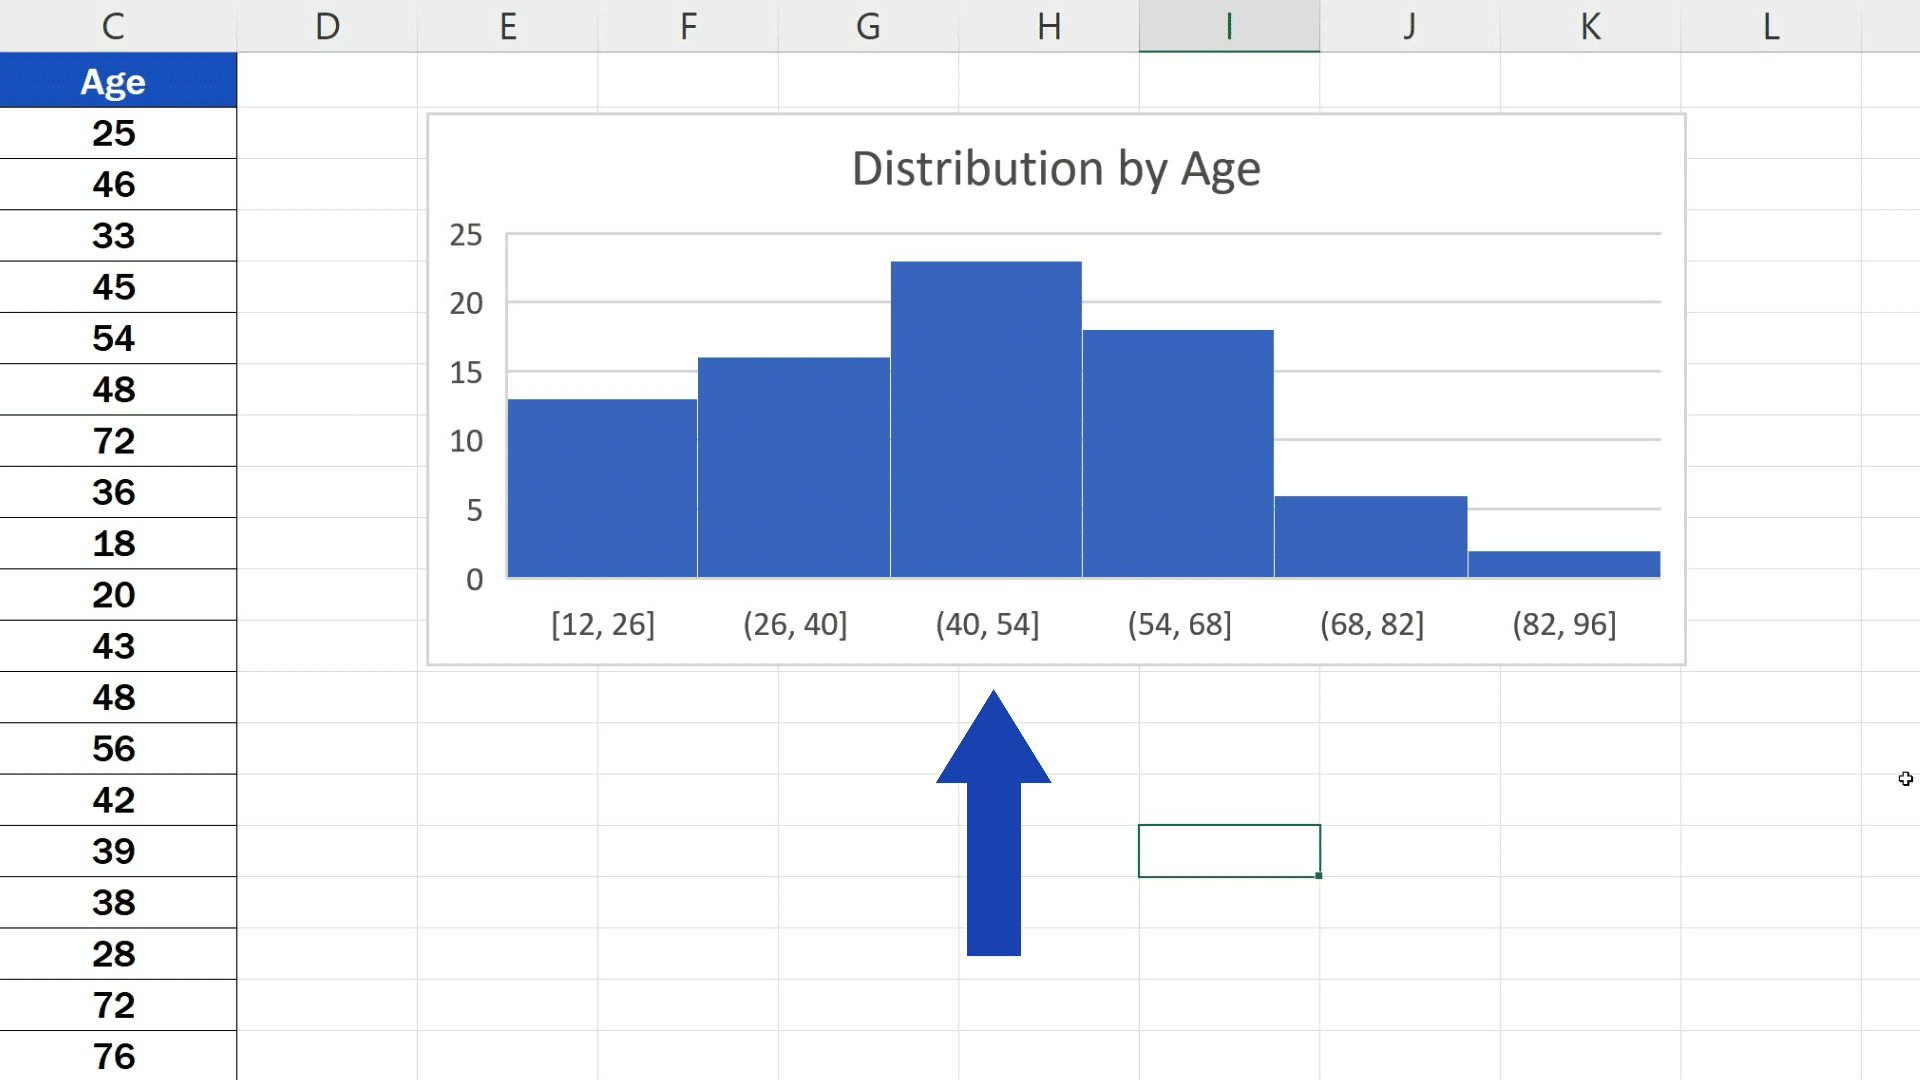
如果您想在Excel中显示直方图,即频率分布的图形表示,只需按照以下说明操作即可。

  • 首先,在“Windows按钮”☻“Excel选项”☻“加载项”☻“Go”☻“分析功能”下激活分析功能。
  • 然后输入您的(排序后的)原始列表和上限。
  • 然后,在“数据”选项卡中,点击“数据分析”(此工具仅在分析功能激活后可用;见第1点)。
  • 然后点击“插入”,再点击“插入统计图”和“直方图”。或者,您也可以通过“所有图表”选项卡进入“推荐图表”。
  • 点击新列的第一个单元格,选择输出范围,并勾选“累积频率”和“图表视图”复选框。然后创建直方图。

然后:设置直方图的格式

最初,Excel图表看起来像柱状图。因此,右键单击一列并打开“设置轴格式”。

  • 选择您要使用的格式选项。例如:选择“系列选项”选项卡,将“间隙宽度”更改为“无间隙”。
  • 现在,您仍然可以选择“单色线”,并在“边框颜色”下选择一种颜色,将边框厚度更改为2磅,例如在“边框类型”中,以便区分不同的类别。
Related Articles

Leave a Comment