1.1K
A dashboard is a powerful tool that simplifies complex data and enables you to make informed decisions
What a dashboard is: meaning and examples
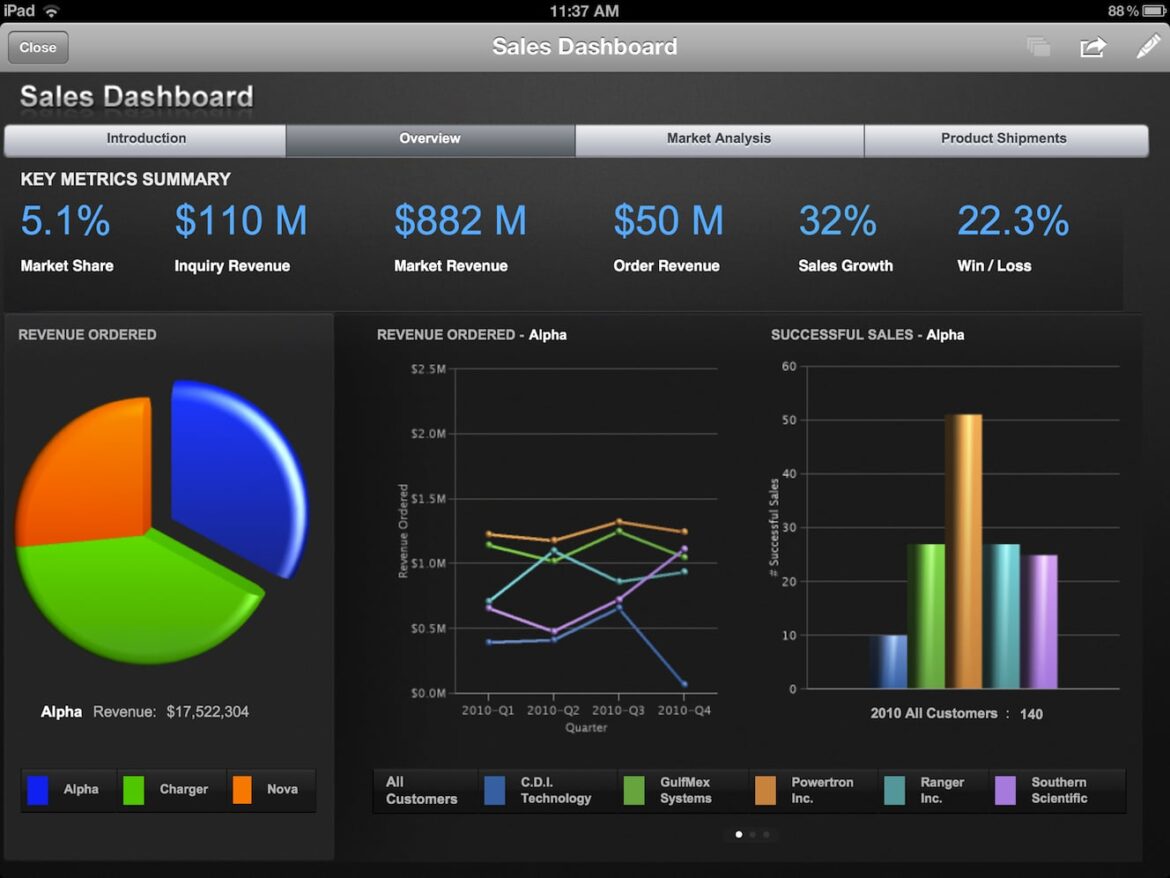
A dashboard is basically a graphical representation of information that aims to present complex data in a clear and easy-to-understand way.
- Like the dashboard of a car, a dashboard provides a quick overview of relevant key figures or data points that are important for a specific task or goal.
- In the dashboard under Mac, you control settings and store widgets such as the calculator and weather display. In another article, we will tell you how to deactivate the Dashboard under Mac OS X.
- The Google Dashboard shows you which data is connected to your Gmail account.
- You can use the user interfaces to configure software and manage it interactively. The dashboard usually responds to your input.
- When you set up a website, the dashboard of WordPress or Joomla! as a content management system (CMS) helps you to design the site and add content.
The functions and types of dashboards
There are different types of dashboards that offer different functions depending on their purpose and objective.
- Operative dashboards: These dashboards are designed to present real-time data to support operational decisions. They often contain key performance indicators (KPIs) and metrics that show the current status and performance of specific processes or activities.
- Analytical dashboards: Analytical dashboards provide detailed insights and allow you to analyze data, identify trends and spot patterns. They often integrate tools such as data visualizations, filters and drill-down functions to enable deeper analysis.
- Strategic dashboards: These dashboards focus on long-term goals and support strategic decision-making. They usually provide an aggregated view of different areas of a company and help managers to understand trends and steer the direction of the organization.
- Customized dashboards: Some dashboards are designed to meet your individual requirements and preferences. They allow you to customize the data displayed, metrics and the appearance of the dashboard.

