Notice: Function _load_textdomain_just_in_time was called incorrectly. Translation loading for the rocket domain was triggered too early. This is usually an indicator for some code in the plugin or theme running too early. Translations should be loaded at the init action or later. Please see Debugging in WordPress for more information. (This message was added in version 6.7.0.) in /var/www/practical-tips.com/wp-includes/functions.php on line 6114

Notice: Function _load_textdomain_just_in_time was called incorrectly. Translation loading for the mailchimp-for-wp domain was triggered too early. This is usually an indicator for some code in the plugin or theme running too early. Translations should be loaded at the init action or later. Please see Debugging in WordPress for more information. (This message was added in version 6.7.0.) in /var/www/practical-tips.com/wp-includes/functions.php on line 6114

Notice: 関数 _load_textdomain_just_in_time が誤って呼び出されました。soledad ドメインの翻訳の読み込みが早すぎました。これは通常、プラグインまたはテーマの一部のコードが早すぎるタイミングで実行されていることを示しています。翻訳は init アクション以降で読み込む必要があります。 詳しくは WordPress のデバッグをご覧ください。 (このメッセージはバージョン 6.7.0 で追加されました) in /var/www/practical-tips.com/wp-includes/functions.php on line 6114
Excel: ヒストグラムの作成 - Practical Tips

Excel: ヒストグラムの作成

by Corinna

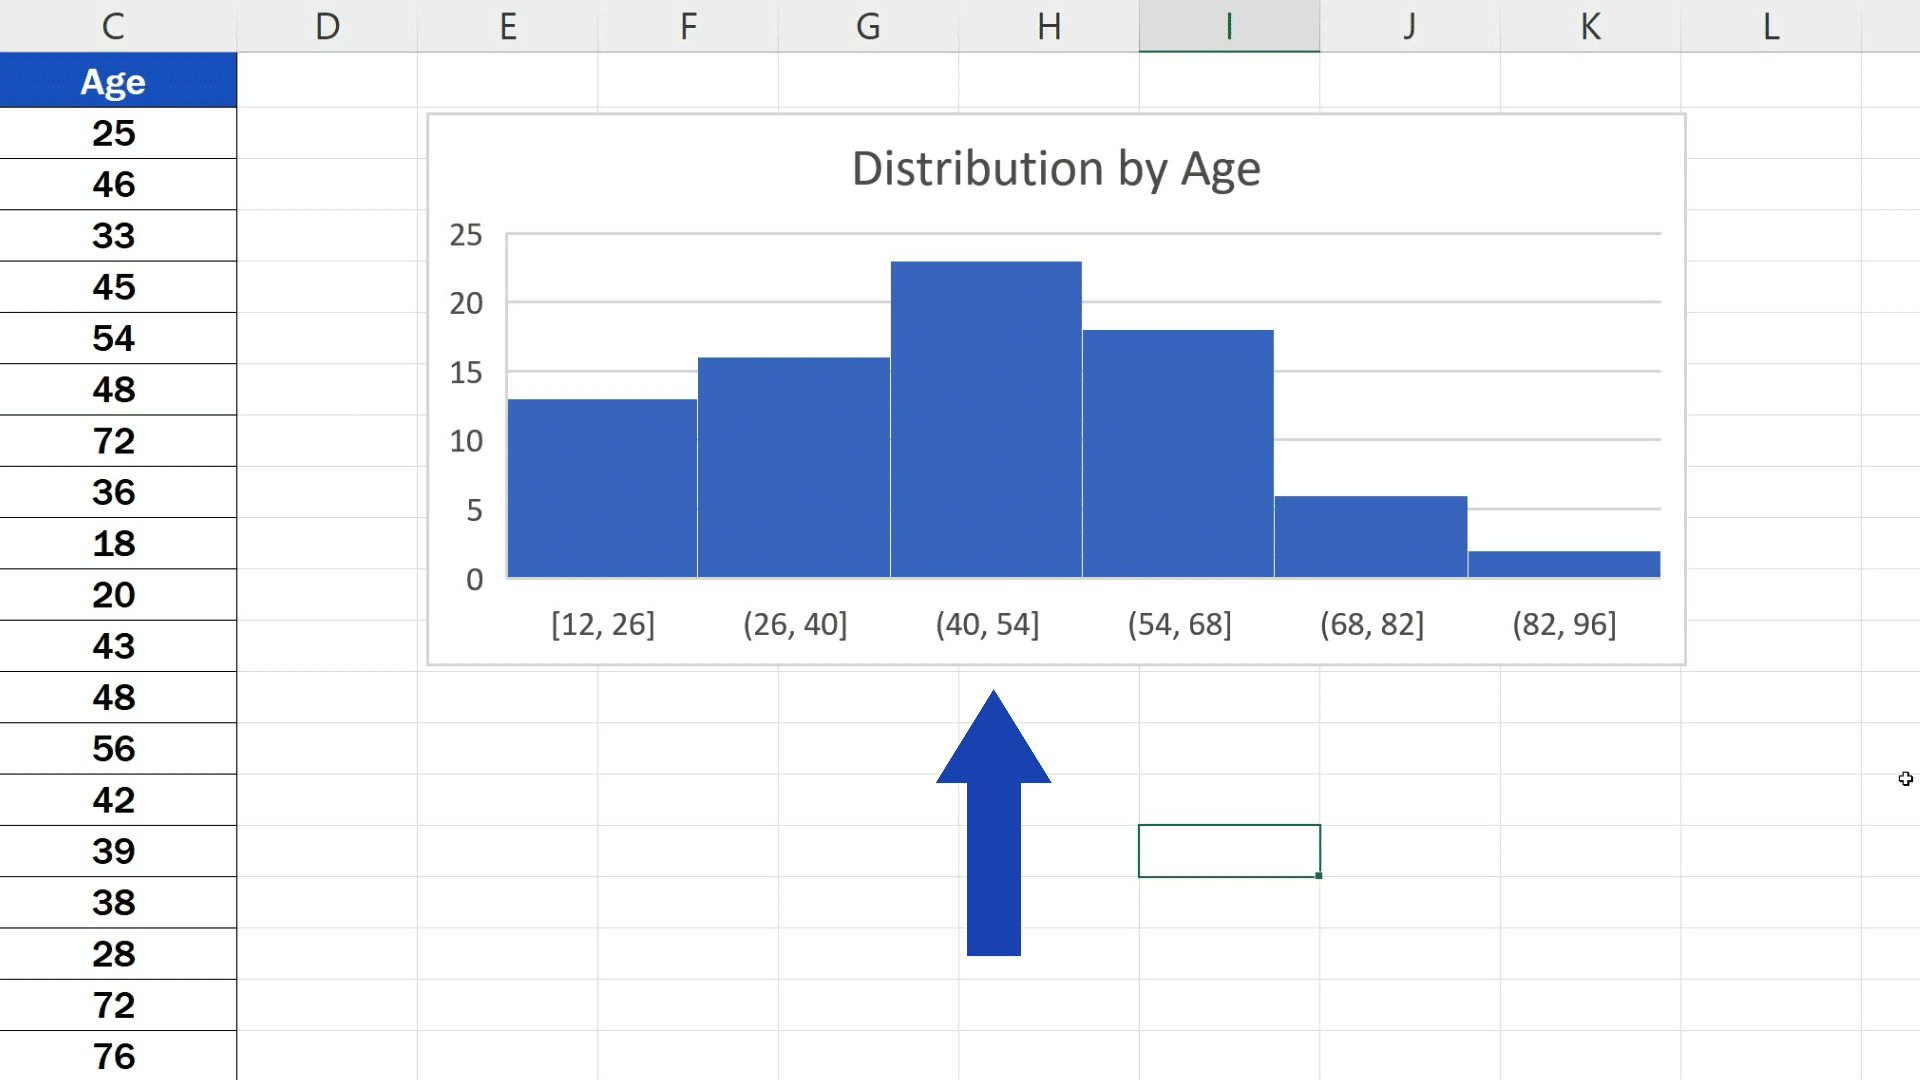
Excelでは、等しい大きさのクラスで明確なヒストグラムを作成できます。Excelは累積度数も自動的に計算します。

Excelでヒストグラムを作成する方法

Excelで度数分布のグラフ表示であるヒストグラムを表示したい場合は、以下の手順に従ってください。

  • まず、「Windows ボタン」 ☻ 「Excel のオプション」 ☻ 「アドイン」 ☻ 「追加」 ☻ 「分析機能」で分析機能を起動します。
  • 次に、ソートした元のリストと上限値を入力します。
  • 次に、「データ」タブで「データ分析」をクリックします(このツールは分析機能が有効になってから利用可能になります。
  • 次に、「挿入」をクリックし、「統計図表の挿入」をクリックし、「ヒストグラム」をクリックします。 または、「すべての図表」タブから「推奨図表」に進むこともできます。
  • 出力範囲の新しい列の最初のセルをクリックし、「累積度数」と「グラフビュー」のボックスにチェックを入れます。次にヒストグラムを作成します。

次に、ヒストグラムの書式設定を行います。

初期状態では、Excelのグラフは縦棒グラフのようになっています。そのため、棒グラフを右クリックして「軸の書式設定」を開きます。

  • 使用する書式オプションを選択します。 例:「シリーズオプション」タブを選択し、「ギャップ幅」を「ギャップなし」に変更します。
  • 次に、「単色線」と「フレーム色」の下の色を選択し、例えば「フレームタイプ」でフレームの太さを2 ptに変更して、個々のクラスを区別できるようにします。
Related Articles

Leave a Comment