511
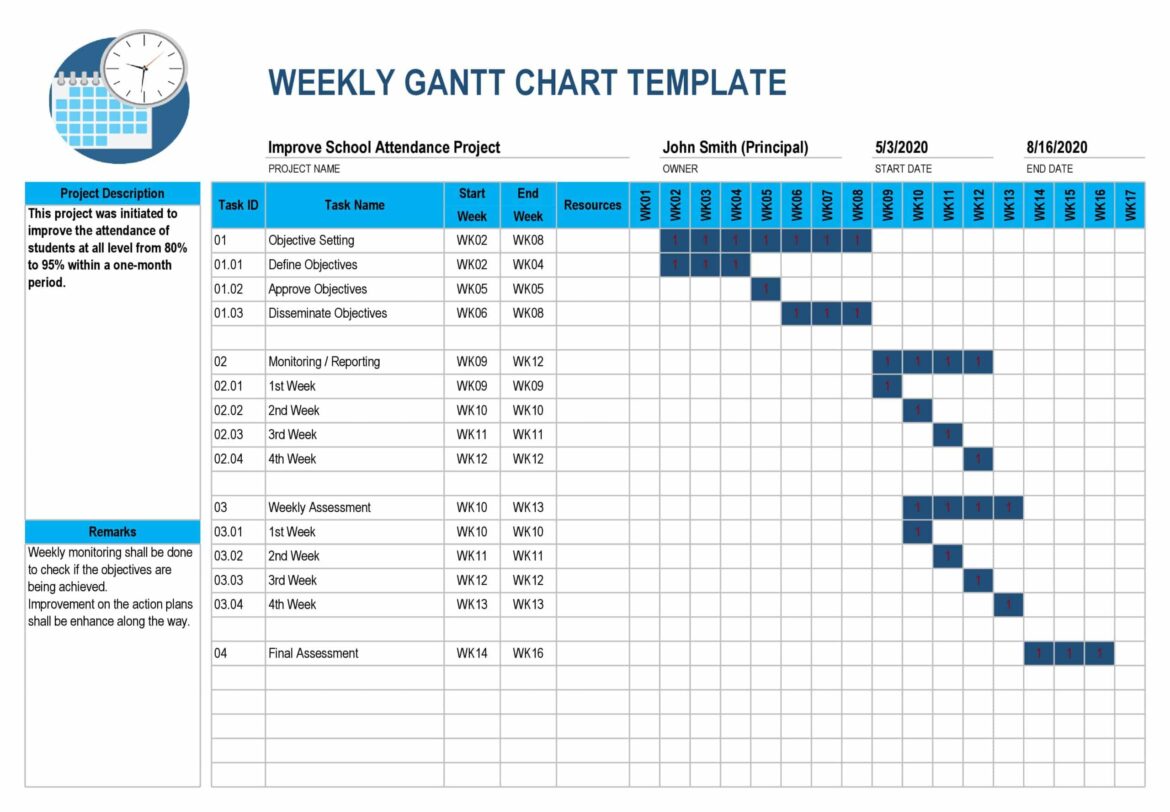
Excel is one of the first choices for displaying a Gantt chart. With such a diagram, you can, among other things, clearly display a project schedule.
Gantt chart in Excel: more insight for smaller projects
The bar chart, better known under the name of its inventor, management consultant Henry L. Gantt (1861 – 1919), is often used in project management. In particular, for smaller projects, you can use the Gantt chart to clearly display the various time steps in Excel. Another advantage of the Gantt chart is that it can be changed very quickly and easily.
- The Gantt chart consists of an ordinate and an abscissa.
- On the ordinate – also called the Y-axis – you can display the individual project phases.
- The abscissa – also called the X-axis – contains the chronological sequences of the project sections.
- You then break down your project into meaningful project phases.
- You then enter the individual project phases in chronological order on the Y-axis.
- To make it easier to see what is happening, it is always a good idea to leave a blank line between the individual steps.
- Then visualize the respective duration of the individual project phases using bars on the X-axis.
- The so-called “critical path” – sections that are directly dependent on each other – is usually indicated with an arrow.
Step by step: Create a Gantt chart in Excel
For our example, we are planning an event. To do this, we enter tasks, start and end dates, and duration in days in a classic Excel spreadsheet.
- In the first step, you create your Gantt chart with a bar chart. To do this, type in an empty cell in Excel. Then go to the top and select Insert-Tab.
- Now click on the bar chart icon and select the stacked bars from the list.
- An empty window will appear where you can create your Excel Gantt chart. Enter the start dates and durations of your tasks there.
- To transfer the start dates and durations from the table to the Gantt chart, right-click anywhere in the empty chart. Then select “Data”. A new window will open.
- At the bottom left, you will find an Add button. Click on it to open another window. Click on the “Series Name” field and then on a column heading.
- Click in the “Series Values” field below and empty it. Select the first cell with the start date in your task table, highlight all the dates with the mouse and enter them in the “Series Values” field. Then confirm with “OK”.
- Proceed in the same way if you want to add the duration of each order to your Gantt chart in Excel: Click on the Add button under Legend Items (Series) and fill in the two fields in the same way as described above.

